Overview
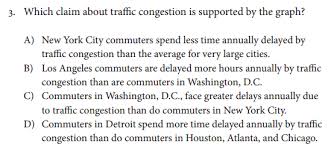
The SAT Mathematics test questions assess different areas of mathematical knowledge and application such as number and operations, algebra and functions, geometry and measurement, probability and statistics, and data analysis. Data analysis questions address students’ ability to interpret information presented in tables, graphs, and charts, recognize change and trends, and analyze change by performing calculations.
Why Graphs?
College students will encounter graphs in many textbooks and journal articles in the humanities, social sciences, physical and biological sciences and other disciplines. Part of the information is presented graphically because it is more economical, as well as adding interest and focus to the presentation. For example, a great deal of numerical data can be summarized by plotting one variable against another on a line graph. Graphic presentations are more accessible to those studying a relationship or phenomenon.
Types of Graphs
Some of the most common graphs are pie or circle graphs, line graphs, bar graphs, and pictographs. Pie charts show relationships of facts to one another by presenting each percentage as a slice of an entire circle. Line graphs are useful as different relationships can be shown by presenting multiple lines. For example, a line graph show the high temperatures for an entire month and the low temperatures for the same month by displaying the dates along the x axis and temperatures on the y axis. Bar graphs present data along x and y axes with rectangular bars rather in lines. Sometimes bar and line graphs are combined on the same chart. Pictographs present data by using small icons to represent a quantity of data. They often accompany texts in economics, newspaper, and magazine articles.
Data Interpretation
Many of the questions regarding graphs, charts, and tables on the SAT require more than recognizing the types of graphs. They require students to interpret the data that is presented. This requires more than looking at the chart. It is important to understand what type of information is being displayed on the graph and what the relationship is between data points. Read the labels to see what is being displayed, and be able to identify the relationships along different points in time. Read questions very carefully to make sure they are understood.
More Strategies for Test Preparation
The same information that is presented in a graph can be presented in a chart. The chart or table can allow for precise figures to use in calculations. Many scientific journal articles require information to be presented in both charts and graphs. That way, students and other researchers can read them, do their own calculations, and draw their own conclusions.
Interested in SAT tutoring services? Learn more about how we are assisting thousands of students each academic year.
SchoolTutoring Academy is the premier educational services company for K-12 and college students. We offer tutoring programs for students in K-12, AP classes, and college. To learn more about how we help parents and students in Lauderhill, FL: visit: Tutoring in Lauderhill, FL


