Overview
A function is a special relationship between variables in an equation such that for every domain value, there is only one range value. Functions can be expressed using a function rule that defines those values. Once enough values have been derived, the function can be graphed.
Independent and Dependent Variables
In order to begin thinking about writing a function, first determine how the variables are related. Does the value of one variable depend upon the value of another? Suppose a plumber charges $75.00 per hour plus a labor charge of $50.00. The cost of the repair depends upon the number of hours it takes. Therefore, if the repair takes 1 hour, the cost of the repair is $125.00, and if it takes 2 hours, the cost is $200.00, and so on. Another way to say that is that the cost of the repair is the dependent variable, and the number of hours is the independent variable. Suppose that a car gets 30 miles to the gallon. The number of gallons used depends upon the number of miles driven. If the car is driven 30 miles, it uses one gallon; 60 miles, 2 gallons; and so on.
Function Notation and Function Rule
After the independent and dependent variables have been identified, the next step is to write an equation. In the plumbing example, y, the cost of the repair, equals $75.00x + $50.00, where x is the number of hours. Since $75.00x + $50 defines the function, it is the function rule. Similarly, the number of gallons used, y, equals the number of miles driven, x, divided by 30. The function rule of x/30 defines the function. Function notation is substituted for the dependent variable y, so that f(x) = $75.00x + $50.00, or f(x) =x/30. Functions are usually represented with the letters f, g, or h, so they may be expressed as f(x), g(x), or h(x).
Organizing a Table
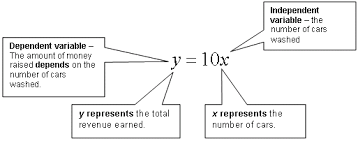
The first step to graphing a function is to organize a table with values of x and y. It is better to use many values to show a pattern. Suppose that the function is a simple one, such as f(x) = 10x. Then if x =1, f(x) = 10; if x=2, f(x) = 20, x =3, f(x) =30, and so on. If the domain of a function is given in a problem as specific values of x, only use those values, but if it is not specified, the domain is all real numbers.

Graphing a Function
After the table with values of x and y is generated, points can be plotted using Cartesian coordinates. Once the pattern is established, a line or smooth curve can be drawn through them. If the domain of x is all real numbers, the endpoints of the line can be drawn as arrowheads.

Interested in math tutoring services? Learn more about how we are assisting thousands of students each academic year.
SchoolTutoring Academy is the premier educational services company for K-12 and college students. We offer tutoring programs for students in K-12, AP classes, and college. To learn more about how we help parents and students in Holyoke, MA: visit: Tutoring in Holyoke, MA