Overview:
In a mathematical function, each value of x (the domain) can be matched with only one value of y (the range). If there is one value for x, but multiple values of y, the relationship is not a function, but a relation. Many different types of functions can be described by plotting the values of x and y on a coordinate plane. Functions can be described graphically, by their equation, by listing a finite number of ordered pairs, or by listing their defining rule.
Functions and Relations
When ordered pairs are graphed in a function, one value of x can be matched with one value of y. Suppose the set of ordered pairs is {(3, 5), (4, 6), (5, 7), (6, 8), (7, 9) …}. It is a function, because the value of x predicts the value of y. Similarly, suppose the set of ordered pairs is {(3, 2), (4, 2) (5, 2), (6, 2) …}. It is also a function, because the value of x is also matched with one value of y. It isn’t a very interesting function. However, if the set of ordered pairs is {(3,2), (3,3), (3,4), (1,2), (2,2), (4,3)} it is not a function, but a relation. The x-value of 3 has 3 different y-values. There are sets of ordered pairs, but they do not describe unique relationships between values of x and values of y.
Linear Functions
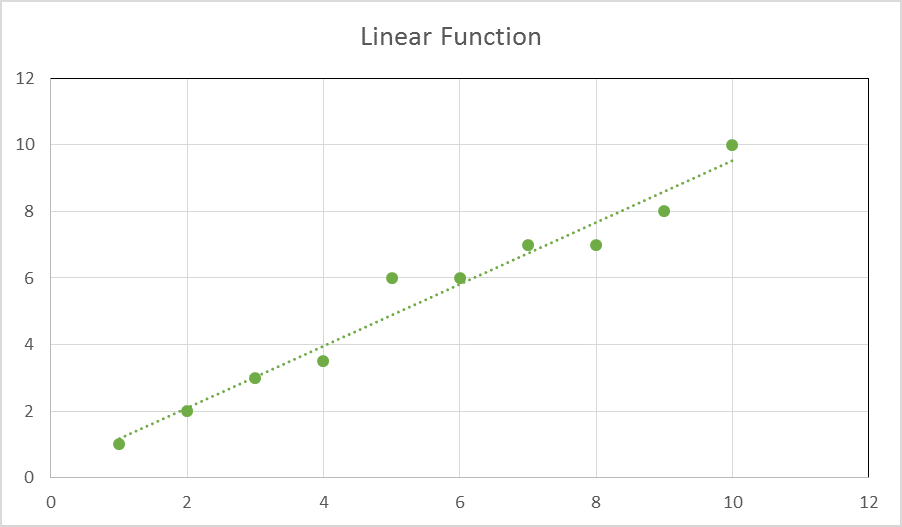
Equations that have the form y=mx + b (the slope-intercept form) have one x for one y, and are called linear functions. A simple equation such as y=x is a linear function, as is 2x = y, and so is 2y = 4x + 20. When a line is fit to data, the line itself is a function (even if the raw data from the scatterplot describes a relation).
|
Figure 2: The raw data from the scatterplot describes a relation, but the line of best fit is a linear function. |
Exponential Functions
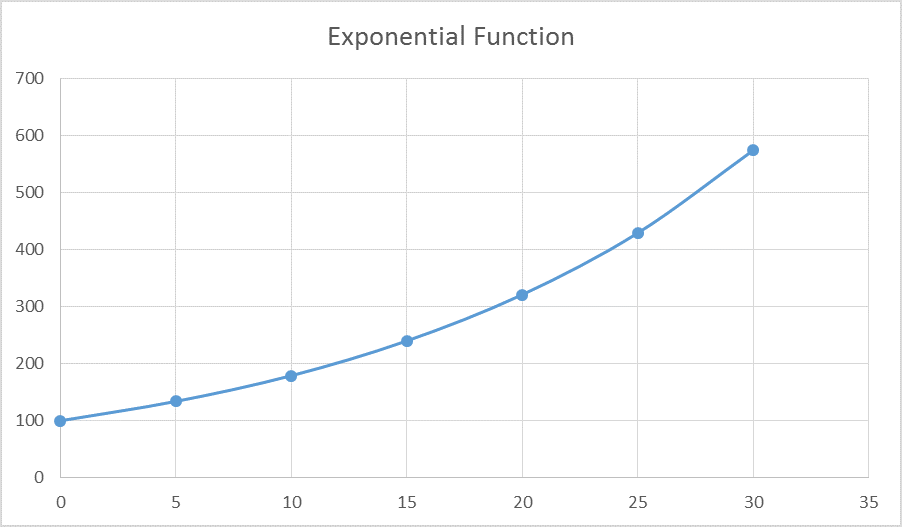
Like linear functions, exponential functions of growth or decay have values of x that correspond to values of y. The graph of an exponential function is a curved line. Suppose that $100.00 is invested at 6% compound interest. Compound interest is an example of exponential growth. In this case, the equation is y = 100(1.06)x, where x is the number of years and y is the amount saved. The values in ordered pairs are {(0, 100), (5, 134), (10, 179), (15, 240), (20, 321), (25, 429), (30, 574)}. There are many real-life examples of exponential functions besides compound interest, such as many forms of biological growth and decay.
|
Figure 3: Exponential functions still show the relationship between values on x and values of y. |
Quadratic Functions
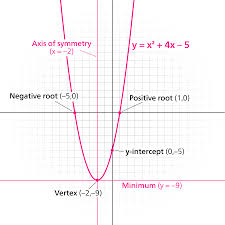
Quadratic equations, such as y = ax2 + bx + c, take the form of a parabola when they are graphed. The parabola for an equation of this form is vertical. If the coefficient for a is positive, the parabola opens up, and if the coefficient for a is negative, the parabola opens down. There are many real world examples of parabolas, including the path of a tossed ball, the spray of water in a fountain, and the path of a cliff diver.
|
Figure 4: Quadratic functions take the shape of a parabola. |
Interested in algebra tutoring services? Learn more about how we are assisting thousands of students each academic year.
SchoolTutoring Academy is the premier educational services company for K-12 and college students. We offer tutoring programs for students in K-12, AP classes, and college. To learn more about how we help parents and students in Albuquerque, NM visit: Tutoring in Albuquerque, NM.


