Overview
Many real-world situations can be approximated by the relationship between two different variables that fall on a straight line. The linear equation is one model of the data. Sometimes the task is to predict another value from a small amount of data, while other times it is to find a relationship between large amounts of data. The task is always to understand the problem, make a plan, find the answer, and check.
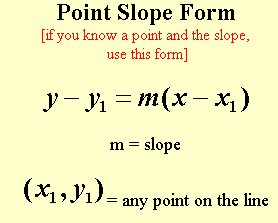
The Point-Slope Equation
Recall that if the coordinates of one point on a line and the slope of that line are known, the equation for that line can be derived by using the slope to find another point on the line. Suppose that one point on a line has the coordinates (1, 3) and the slope of the line is 2. Any other point on the line will have the coordinates (x, y). The difference of the y coordinates is (y -3) and the difference of the x coordinates is (x-1). Therefore, (y-3)/(x-1) equals 2, because we already know that the slope is 2. If both sides of the equation are multiplied by (x-1) to get the (x-1) out of the denominator, then 2(x-1) = y-3, or 2x-2 = y-3, and 2x-2 +3 = y. Therefore, 2x +1 =y and that is the equation of the line. Another way to say this in general is the point-slope equation: y-y1 = m(x-x1).
Organizing Data
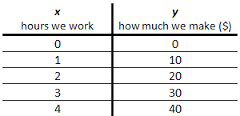
There are different ways to organize data to make their relationship more clear. Perhaps there are just one or two ordered pairs of data to calculate from, and it is reasonable to assume that the relationship is linear. The point-slope equation might be a good option.
Line of Best Fit
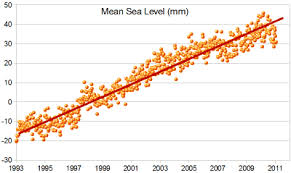
Suppose there are many ordered pairs. A chart could be drawn of the data, and the ordered pairs could be plotted. At that point, a line could be drawn through the data so there are about as many data points above the line as below the line. This is referred to as the line of best fit.
Applications
Many different types of data can be described as ordered pairs on a graph. In the graph above for the line of best fit, the year is shown as the x-coordinate and the sea level is shown as the y-coordinate. Sports records can be shown from year to year.
Interested in math tutoring services? Learn more about how we are assisting thousands of students each academic year.
SchoolTutoring Academy is the premier educational services company for K-12 and college students. We offer tutoring programs for students in K-12, AP classes, and college. To learn more about how we help parents and students in Grand Forks, ND: visit: Tutoring in Grand Forks, ND