Overview:
When data points are plotted onto a standard graph, that is only the first step in determining the nature of the relationship. The next step is to determine if the data follow a linear relationship, and then fit a line to the data. While a line might not describe all the data points, if one is applicable, it will describe the general trend.
Scatterplots:
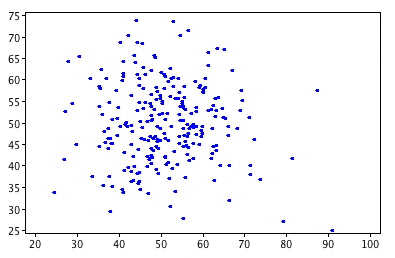
A scatterplot shows the exact values of data as it is plotted onto a graph. Those data points can show many different relationships: a positive relationship (as the value of x increases, the value of y increases), a negative relationship (as the value of one variable increases, the value of the other variable decreases), or no relationship at all. In the real world, the values don’t often fall along a straight line.
|
Figure 1: Exact values in this scatterplot show the individual scores on a measure x and a measure y. |
Finding a Line by Estimation:
If the data appear to follow a linear positive or negative relationship, a line can be estimated that will follow the direction of the trend. It may not pass through all the data points, but it will be relatively close to all of them. This estimate can be done by drawing a line on the graph itself.
|
Figure 2: A line best fit estimates of the relationship between the data points. |

Correlation:
Lines of best fit can sometimes be estimated by drawing a line through the points on a scatterplot, especially if the variables are strongly correlated, or vary together. There are statistical methods for determining the line of best fit by using the values of the data points themselves to construct the line from the data. This type of line is called a regression line. It has a definite slope and y-intercept, and follows the linear equation y=mx +b. Any point on that line can be calculated using the pattern.
Nonlinear Relationships:
Sometimes the best approximation of the data is not a line, but a curve such as a parabola or hyperbola. This is true when the underlying equation has exponential values, such as a quadratic equation. In those instances, a line is not an accurate prediction of that relationship, and a curve is a better model. For example, anxiety and performance are related in a U-shape, so that both low anxiety and high anxiety are related to low performance.
Interested in statistics tutoring services? Learn more about how we are assisting thousands of students each academic year.
SchoolTutoring Academy is the premier educational services company for K-12 and college students. We offer tutoring programs for students in K-12, AP classes, and college. To learn more about how we help parents and students in Camden, NJ visit: Tutoring in Camden, NJ