The variance and standard deviation are measures of how spread out a distribution is. These are widely used to measure variability or diversity. Standard deviation is a number that indicates how much on average each of the values in the distribution deviates from the mean (or center) of the distribution. Variance measures the same thing as standard deviation (dispersion of scores in a distribution). Variance, however, is the average squared deviations about the mean. Thus, variance is the square of the standard deviation. A low standard deviation indicates that the data points tend to be very close to the mean, whereas high standard deviation indicates that the data points are spread out over a large range of values.
Standard deviation is represented by Greek letter sigma, σ. Square of sigma, σ2, represents variance. The variance is computed as the average squared deviation of each number from its mean (μ).
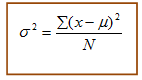
To calculated variance find mean (μ) first. Then for each value(x1, x2, ..xn) in the distribution, subtract the mean and square the difference. Then add all the squared difference and divide by the number (N) of values in the list.
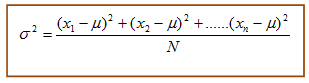
The above formula can also be written as:
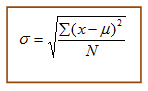
The standard deviation is given as:
Example:
Let the list of numbers be: 2, 5, 6, 4, 3
Mean = (2 + 5 + 6 + 4 + 3)/5 = 20/5 = 4
Square the difference of each point from mean:
(2 – 4)2 = (-2)2 = 4
(5 – 4)2 = (1)2 = 1
(6 – 4)2 = (2)2 = 4
(4 – 4 )2 = (0)2 = 0
(3 – 4)2 = (-1)2 = 1
Average these values:
(4 + 1 + 4 + 0 + 1)/5 = 10/5 = 2
Hence, variance σ2 is 2
Standard deviation σis sqrt(2) ≈ 1.414
SchoolTutoring Academy is the premier educational services company for K-12 and college students. We offer tutoring programs for students in K-12, AP classes, and college. To learn more visit SchoolTutoring Academy.