Overview
Values for x and y can be graphed on the Cartesian coordinate plane. If x and y are terms in a linear equation, they can be graphed in a line. The measurement of the rate of change between variables gives the slope of the line.
Rate of Change
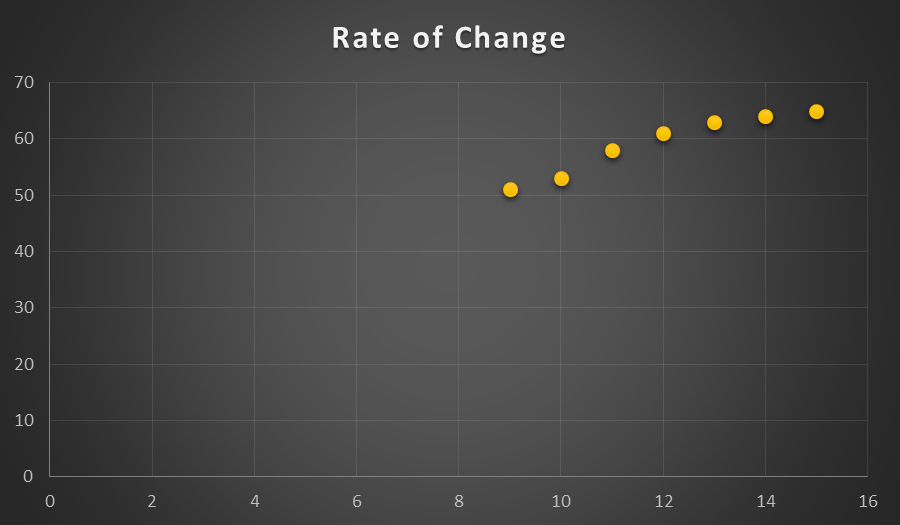
Many values for variables can be graphed against one another, and successive values can be compared with each other to determine the rate of change, or the steepness of the graph. The rate of change can be measured between two points on the graph (x1, y1) and (x2, y2) by dividing the difference between the y-values (y2 – y1) by the difference between the x- values (x2 – x1). If the rate of change is an increase, its value will be positive. If there is no change, the rate of change is zero, and if the rate of change is a decrease, its value will be negative. Suppose that one child’s growth in inches is measured from age 9 to 15, and plotted on the graph below. The exact values of growth are not on a straight line, so the rate of change is not equal for every year. For example, the rate of change between ages 10 and 12 is (61 – 53 = 8)/ (12 – 10 = 2), 8/2 or 4 inches per year. However, the rate of change between ages 13 and 15 is (65 – 63 = 2)/ (15 – 13 = 2) 2/2, or 1 inch per year. Although the rate trends upward, so it is positive, it is not a constant rate of change.
Figure 1: The rate of change can be calculated by comparing successive values of variables.
Constant Rate of Change
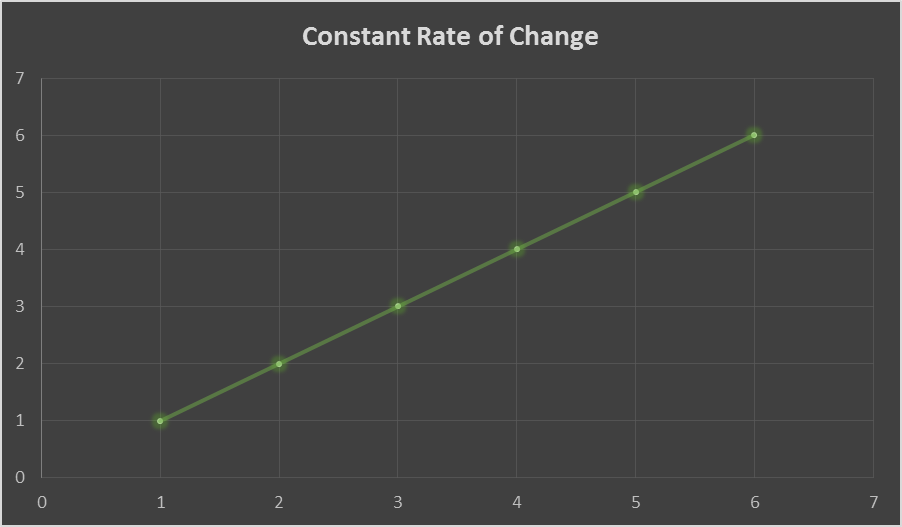
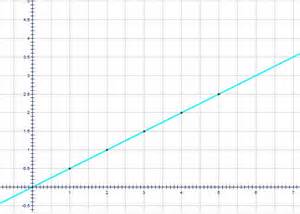
Unlike the previous example, many items have a constant rate of change. All the points lie on the same straight line. Suppose that a set is graphed with the values {(1, 1), (2, 2), (3, 3), (4, 4), (5, 5), (6, 6) and so on}. The rate of change between points 2 and 1 is (2-1=1)/(2-1=1). The rate of change between points 5 and 4 is (5-4=1)/(5-4=1). It is constant at any point of the line.
Figure 2: If the rate of change is constant, it is constant at any point on the line.
Horizontal and Vertical Lines
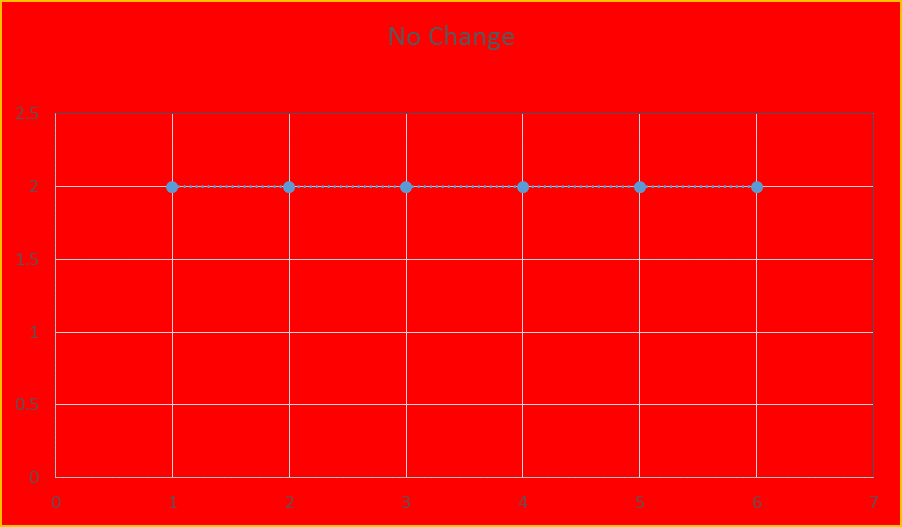
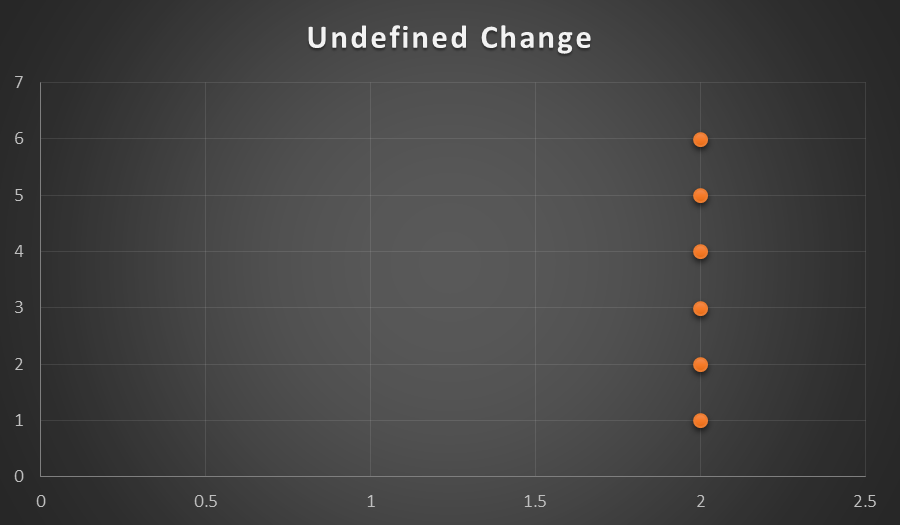
Horizontal lines have a slope of zero, because there is no change. Suppose a set is graphed with the values {(1, 2), (2, 2), (3, 2), (4, 2), (5, 2)}. The rate of change is constant, because all the values fall on a straight line. Using the formula for slope (2-2=0)/ (4-3=1) or 0. Vertical lines are undefined using this definition of the slope of a line. Suppose a set is graphed with the values {(2, 1), (2, 2), (2, 3), (2, 4), (2, 5)}. Using the formula (4-3=1)/ (2-2=0), dividing by zero is undefined.
Figure 3: A horizontal line has no change, while a vertical line has undefined change.
Slope-Intercept Equations for Lines
The constant rate of change between any two points on a line is called the slope of the line. It is the amount of change in the height of the line for one unit to the right. The y-intercept is the point where the line crosses the y- axis. Any line with form y = mx + b has slope m and y- intercept b.
Figure 4: A linear equation is in the form y = mx +b.
Interested in algebra tutoring services? Learn more about how we are assisting thousands of students each academic year.
SchoolTutoring Academy is the premier educational services company for K-12 and college students. We offer tutoring programs for students in K-12, AP classes, and college. To learn more about how we help parents and students in Casper, WY: visit Tutoring in Casper, WY