Overview
Relationships between data points can often be represented on graphs. They can also be expressed in ordered pairs as relations or functions.
Relationships and Graphs
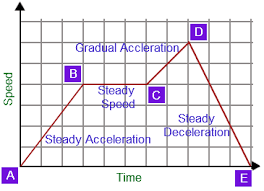
One of the many ways that relationships between the values of variables can be represented is on a graph. Traditionally, the x axis is the horizontal axis (also known as the independent variable), and the y axis is the vertical axis (also known as the dependent variable). The different relationships between variables can be described by key words. For example, a horizontal line stays at the same value, such as a temperature staying constant. If a line slants upward, the value is rising, such as the temperature rising during the day to reach its highest value. If a line slants downward, the value is falling, such as the temperature falling after sundown towards its lowest point. Graphs are often read from left to right, because the x axis is measured from 0 to the highest value.
Continuous or Discrete
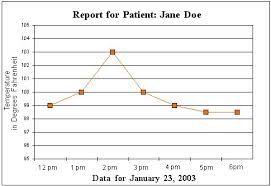
Another way that relationships can be measured on a graph is whether the values are measured and plotted continuously or in a discrete sequence of individual items. Suppose a neurologist is studying a patient’s EEG pattern. Typically, the graph produced by the EEG is a continuous reading of brain waves, showing many peaks and valleys. In contrast, suppose that same neurologist needs to determine if a patient is taking medication on time. She may order blood tests measuring the level of medication every three hours. The level of medication in the patient’s blood can be plotted as separate values on a graph, with discrete measurements in a sequence showing when the patient takes the medication, at least during the time the blood tests are being taken.
Relations
Although relationships between the values of variables can be plotted on graphs, they can also be represented as ordered pairs in brackets, tables, or diagrams. They are presented with the values of x first and the values of y second, such as {(1, 2) (2, 4) (3, 6)}. The values of x {1, 2, 3} are known as the domain, and the values of y {2, 4, 6}, the range.
Functions
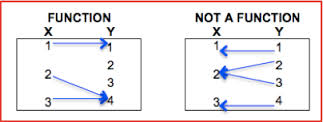
Functions are a special type of relations in which every domain value can be paired with one range value. The set {(1, 2) (2, 4) (3, 6)} is a function. The set {(1,2) (2,2) (3,2) } is also a function, although it isn’t as interesting. The set {(1,2) (1,3) (2,2)} is not a function because the domain value 1 has 2 range values 2 and 3. To determine if a relation is a function, examine the values for the x variable. If a particular value of x is paired with more than one value of y, it is not a function. Therefore, if more than one x has the same value, the relation is not a function.
Function Equations
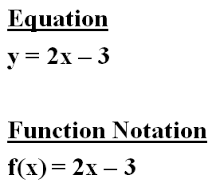
Function equations express the relationship between variables. Suppose a person makes $10.00 an hour. The first hour they work, they make $10.00, the second hour, $20.00; the third, $30.00 and so on. One way to express the relationship in an equation is that the time worked in hours (x) times the amount per hour ($10.00) equals the amount earned (y), or $10.00x =y.
Function Notation
Function notation is a special way that functions are represented in math language. It is a shorthand to describe the relationship between variables. The equation $10.00x =y represents a function where the amount of money that is earned depends on the amount of time worked, or f(x) = 10x.
Interested in math tutoring services? Learn more about how we are assisting thousands of students each academic year.
SchoolTutoring Academy is the premier educational services company for K-12 and college students. We offer tutoring programs for students in K-12, AP classes, and college. To learn more about how we help parents and students in Lawrence, KS: visit: Tutoring in Lawrence, KS